For Feedbacks | Enquiries | Questions | Comments - Contact us @ innovationmerge@gmail.com
What?
- Exploratory Data analysis(EDA) is an approach to extract insights, outliers, required variables and anomalies out of data.
- EDA is an effective technique to understand summary of data present in spreadsheet.
Why?
- Exploratory Data analysis can be used to
- Spot anomalies
- Test hypothesis
- Check assumptions
- Perform Investigations
How?
- Exploratory Data analysis(EDA) is performed using statistics and graphical representations.
- In the area of Data Science, Exploratory Data Analysis is important approach to be taken before stepping into machine learning or creating models phase.
- Some of the graphical techniques used in EDA are:
- Box plot
- Histogram
- Multi-vari chart
- Run chart
- Pareto chart
- Scatter plot
- Stem-and-leaf plot
- Parallel coordinates
- Odds ratio
- Open source python library autoplotter made this analysis easy by providing Graphical User Interface. Autoplotter library is built on top of Dash.
Software’s Required:
- Python 3.6
- Browser
Network Requirements
- Internet to download packages
Implementation
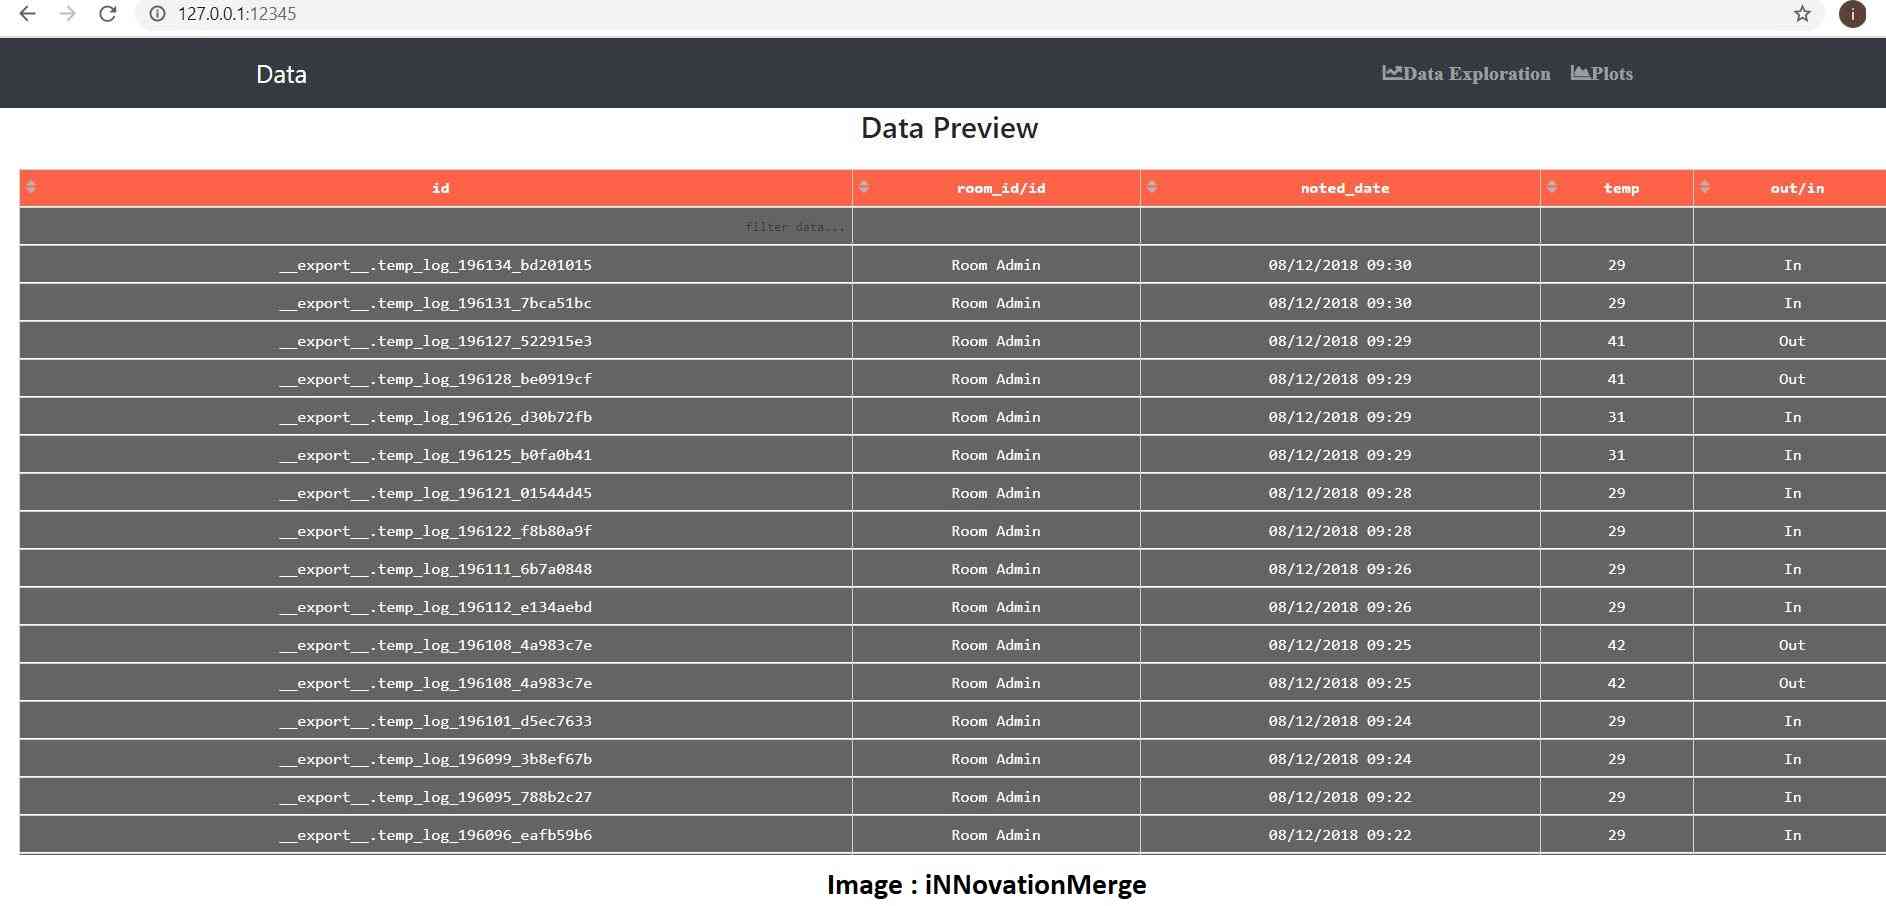
- Any Structured Data can be loaded through Pandas(few lines of code) to Autoplotter and we are ready to get started with different types visualizations, statistical analysis, plotting as per the selected columns and create all the major graphical information.
- Let us explore Relational dataset from IOT devices(temperaure readings) available in Kaggle. For the demonstration purpose we have used only 1000 rows.
Install python package
pip install autoplotterRead data into pandas dataframe
from autoplotter import run_app
import plotly.express as px
import pandas as pd
df = pd.read_csv('IOT-temp_1000.csv')
run_app(df)
autoplotter runs dash on URL

Open URL in browser and Explore
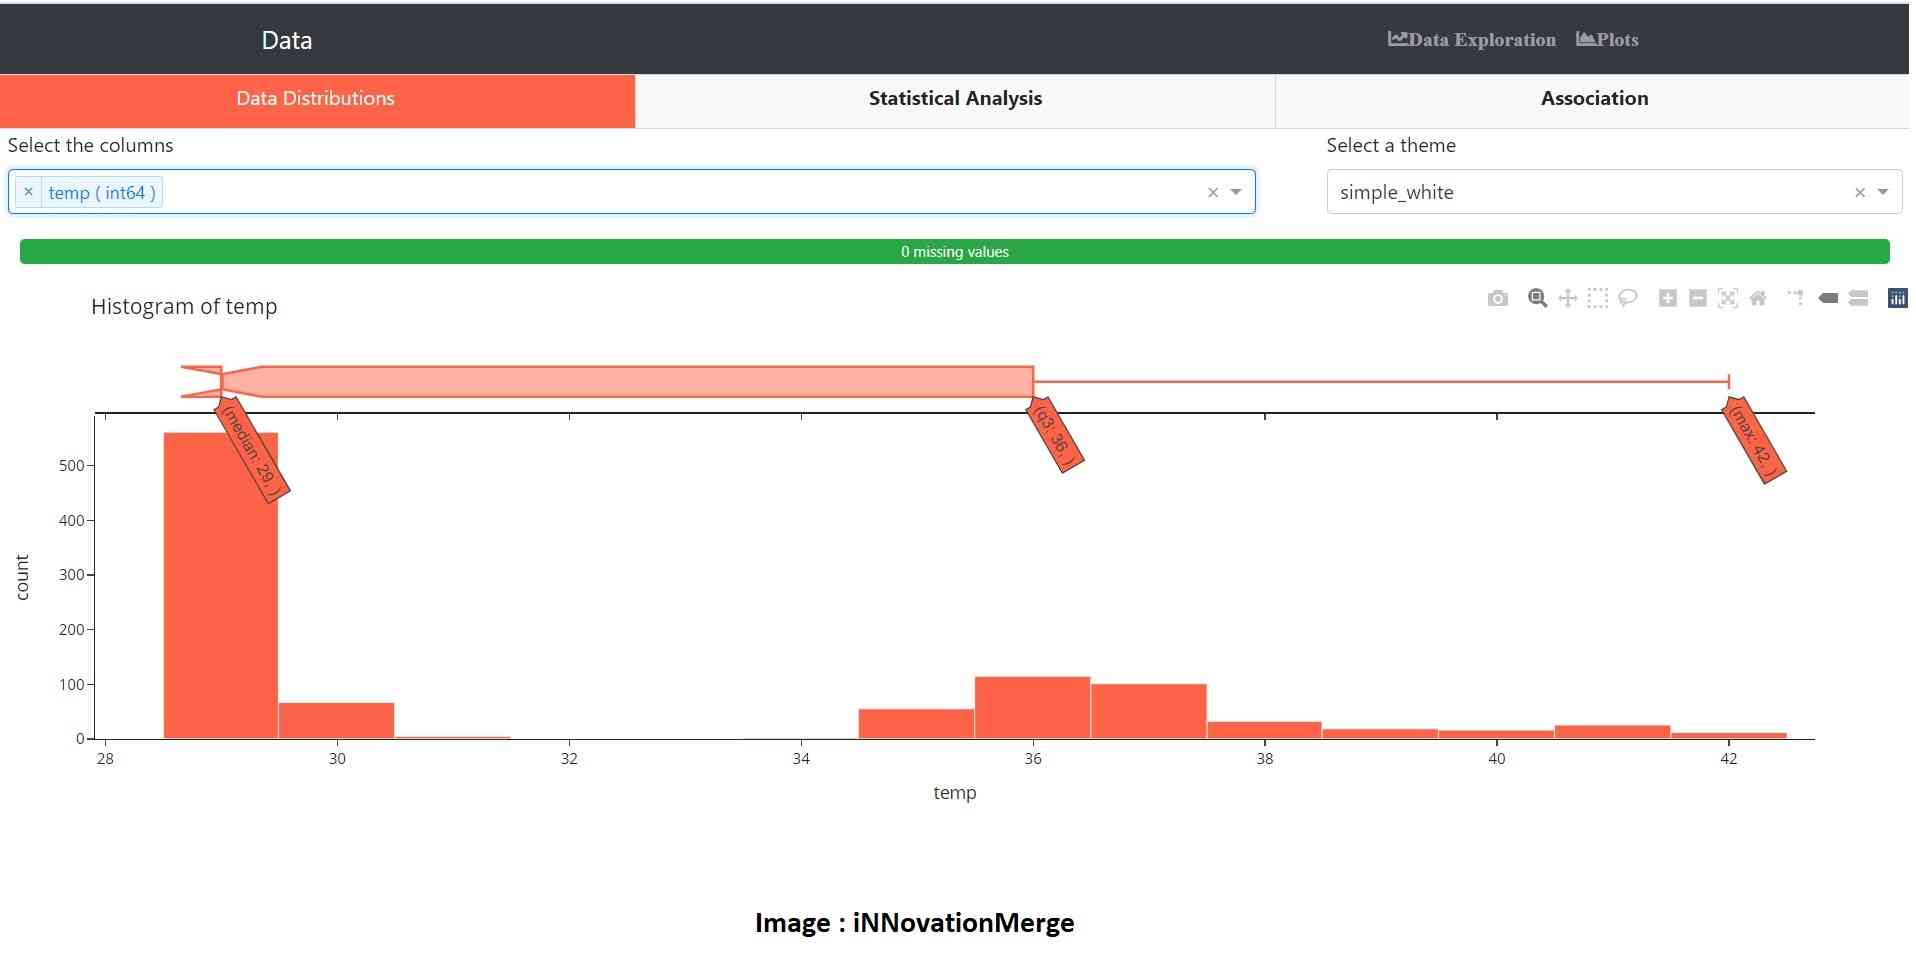
Data Exploration - Data Distribution
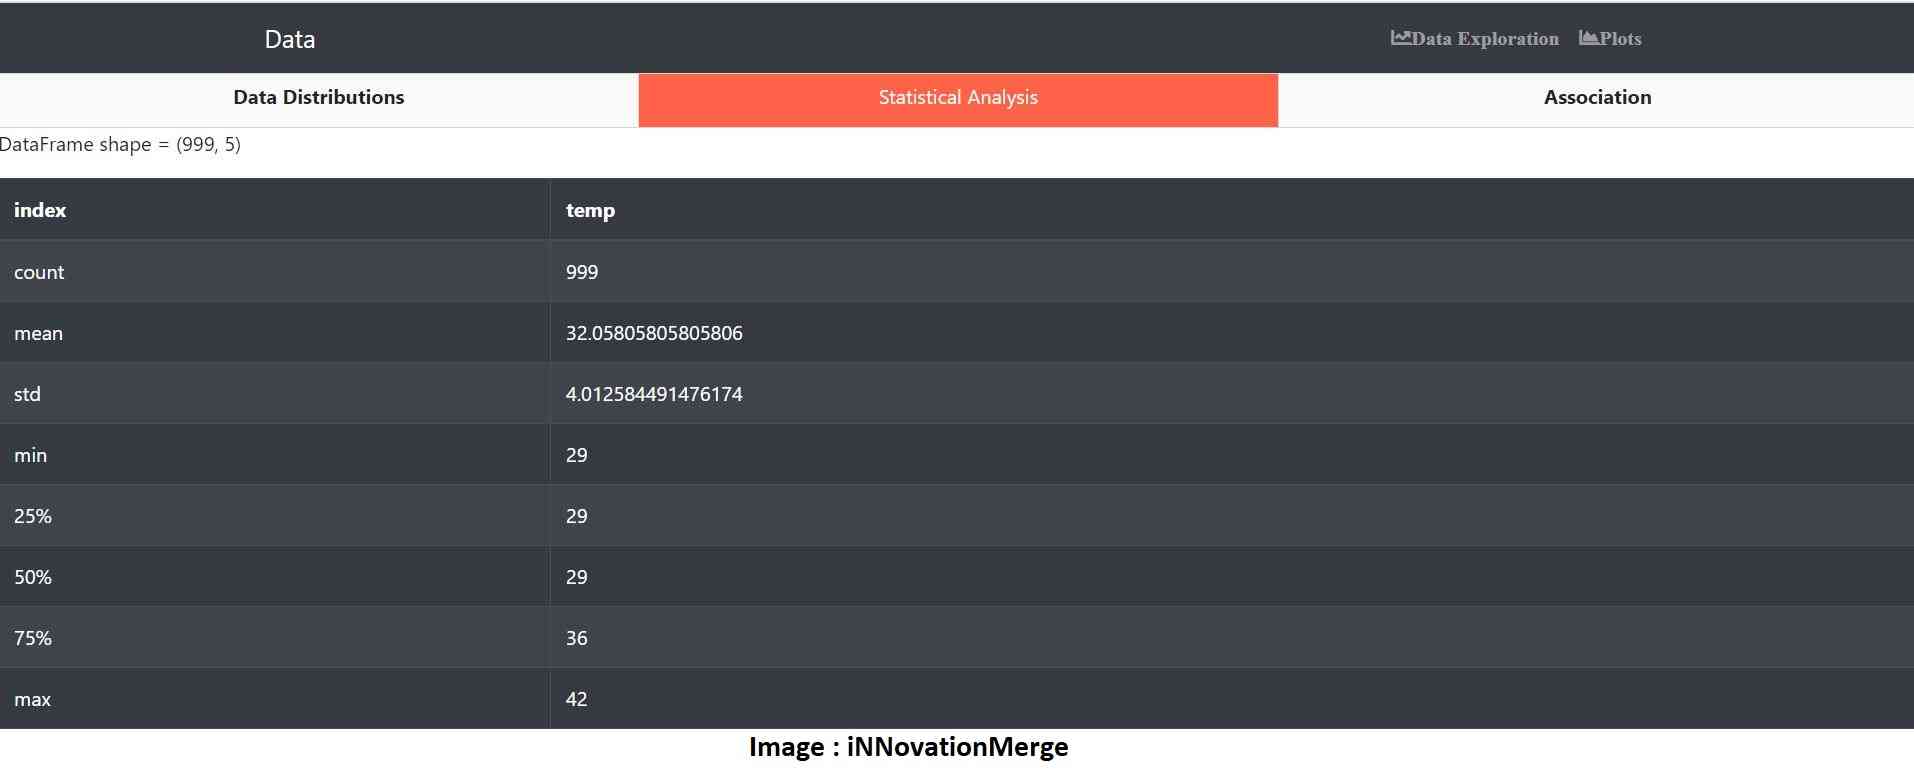
Data Exploration - Statistical Analysis
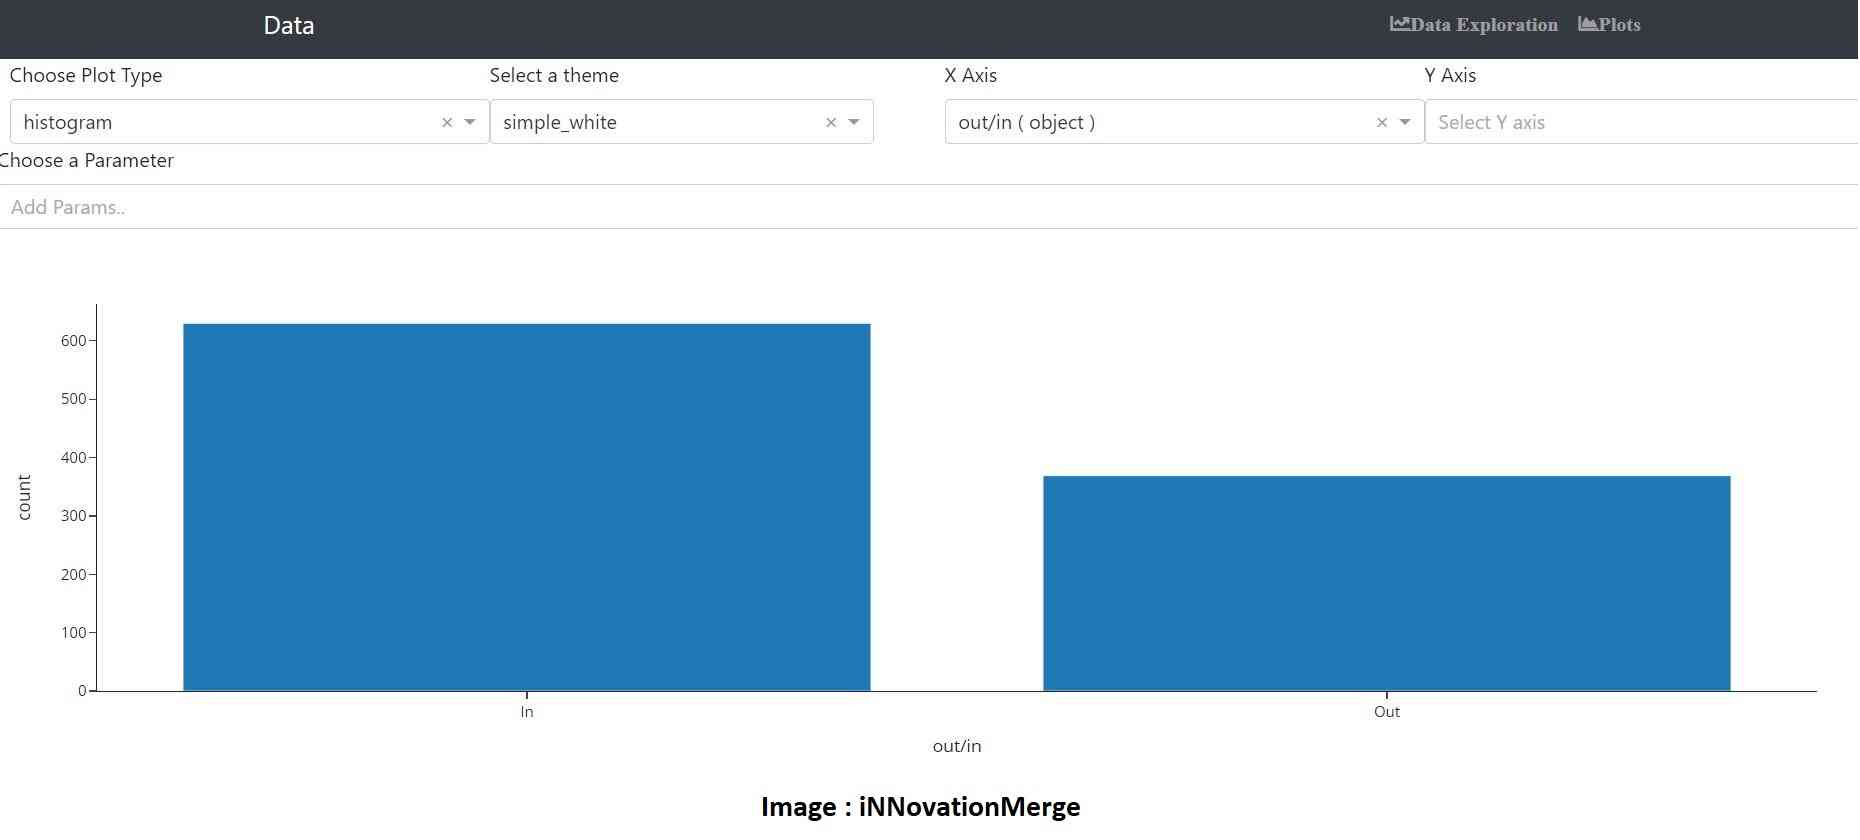
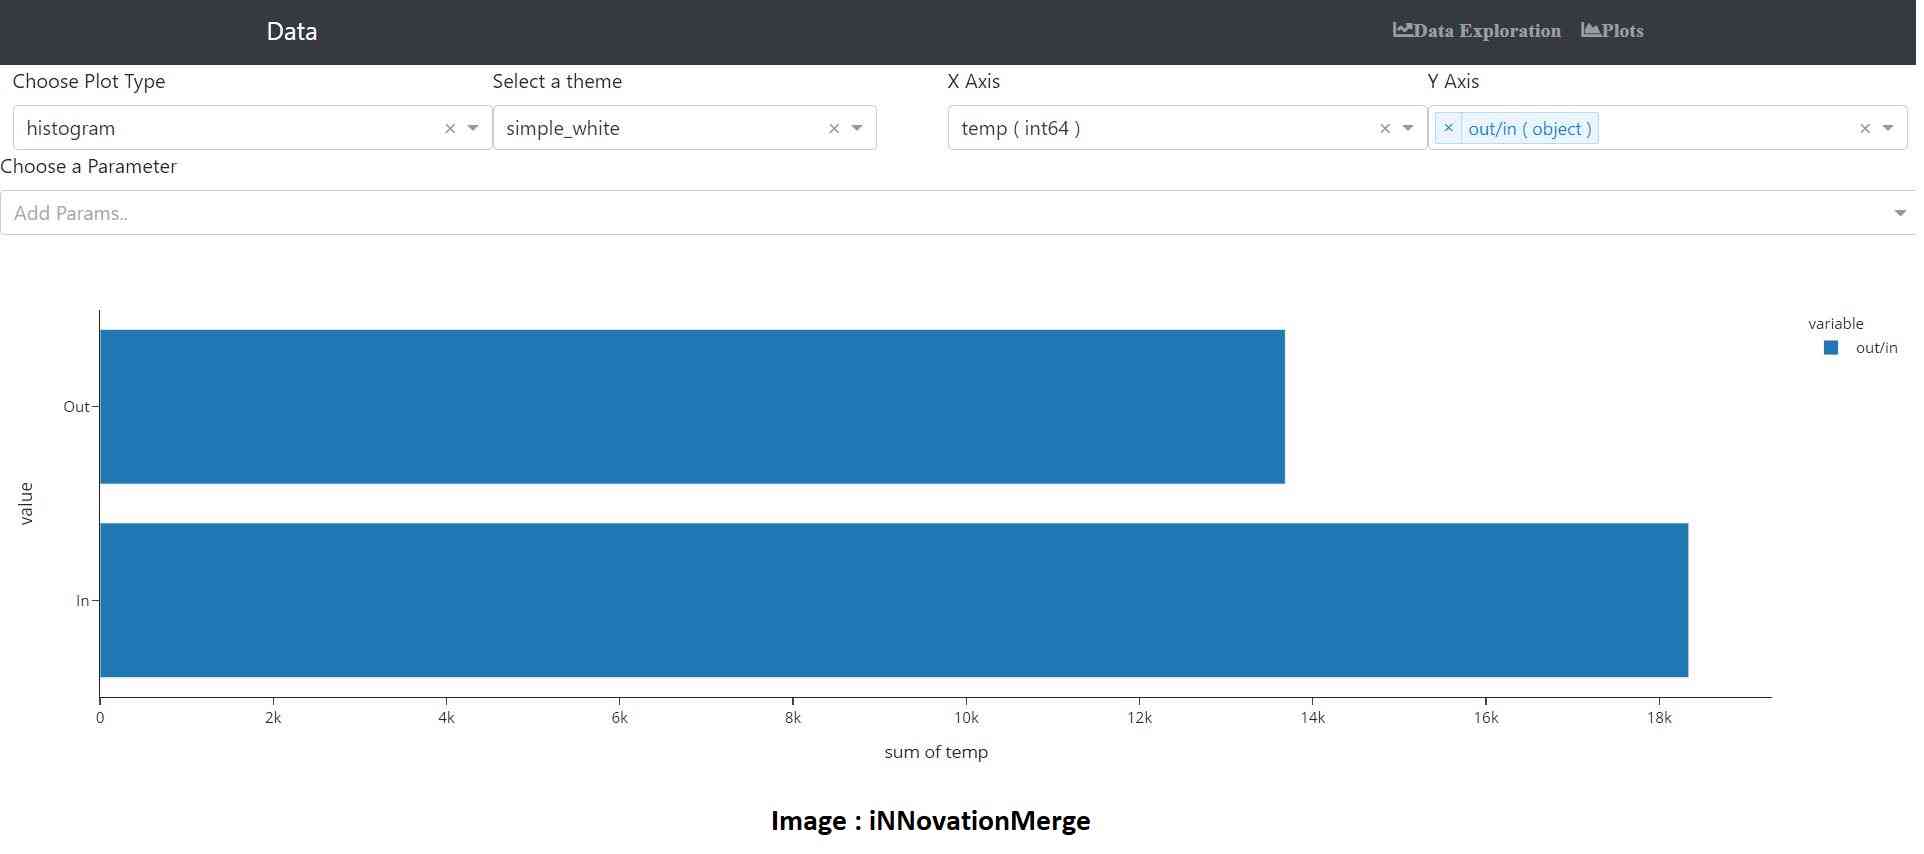
Plots by Count - Univariate analysis
Plots by Variables - Multivariate analysis
Demo