Disclaimer:
- This Article on iNNovationMerge blog is for demonstration purpose.
- Each demonstration presents risk and hazards that must be fully understood before attempting
- It should be performed only by trained professionals
- iNNovationMerge is not responsible for any loss or damage whatsoever caused
- Before attempting understand the Experiment completely or Contact iNNovationMerge for any clarification to get started.
For Feedbacks | Enquiries | Questions | Comments - Contact us @ innovationmerge@gmail.com
What?
- Human can read, understand and represent any Structured, Semi Structured and Unstructured information.
- It’s a challenge for human to make a computers, work in similar fashion. Thanks to technology innovators for making this possible.
- Maximum information in the world is unstructured and one of those data is raw text in English and multiple languages.
- Natural Language Processing, or NLP, is a field of Artificial Intelligence(AI) which focuses on enabling computers to understand and process human languages.
- The latest advances in NLP are easily accessible through open source Python Libraries like NLTK, spaCy etc.,
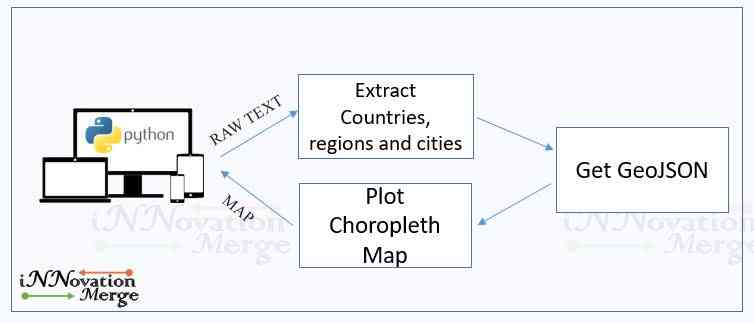
- This article explains how can we leverage NLP to extract Geographical information (Countries, regions and cities) from text and visualize on Choropleth Map.
Why?
- Real time scenarios requires a visualization of maps from the Geographical information generated by different sources
- Automating the process of extracting Geographical information from raw text, determining the location latitude, longitude and coordinates helps business to save time and visualize information in an effective way
How?
Software’s Required:
- Code is tested with below Environment and packages
Network Requirements
- Internet to download packages
Implementation
- This article shows an example by extracting information of Country India, Indian States and Cities of Karnataka from raw text and plotting data of it over choropleth Map.
- The same example can be extended to other countries by using respective GeoJSON.
Block Diagram
Create Python Environment
- Open command prompt/Terminal and run below commands one by one
- conda create -n nnmenv python=3.6.3 pip
- activate nnmenv or conda activate nnmenv
- Install below packages
- pip install plotly==4.9.0
- pip install pandas==1.0.5
- pip install psutil==5.7.2
- pip install requests==2.24.0
- pip install geograpy3==0.1.2
- Download NLTK models
- python -m nltk.downloader punkt
- python -m nltk.downloader averaged_perceptron_tagger
- python -m nltk.downloader maxent_ne_chunker
- python -m nltk.downloader words
- Copy and run below code with any editor
Import required packages
import geograpy
import pandas as pd
import json
import plotly.express as px
Keep Raw text in variable
text = "Bangalore(Bengaluru), is the
capital of the Indian state of Karnataka.
It has a population of about 10 million
and a metropolitan population of about
8.52 million, making it the third most
popular city and fifth most populous urban
agglomeration in India."
Extract geographical information from Raw text
- We found a python module geograpy which will extract geographical information such as countries, regions and cities from URL or raw text.
- It uses Natural Language Toolkit, NLTK internally for entity recognition.
- NLTK is a set of libraries and code for symbolic and statistical natural language processing(NLP) for English written in the Python programming language.
- Named entity recognition(NER) is used in NLP to extract, locate and classify named entities in text.
- Below python function extracts geographical information when text is passed to it.
def getGeoGraphy(text): places = geograpy.get_place_context(text=text) return places.countries,places.regions,places.cities - Output:
Plot extracted geographical information on Choropleth Map
A Choropleth Map is a map composed of colored polygons. It is used to represent spatial variations of a quantity.
Python provides plotly for generating Choropleth Map
It uses GeoJSON to plot required map. GeoJSON is a format for encoding a variety of geographic data structures. GeoJSON supports the following geometry types: Point, LineString, Polygon, MultiPoint, MultiLineString, and MultiPolygon. Geometric objects with additional properties are Feature objects. Sets of features are contained by FeatureCollection objects.
Below is the GeoJSON format for encoding a variety of geographic data structures.
{
  "type": "Feature",
  "geometry": {
    "type": "Polygon",
    "coordinates": [125.6, 10.1]
  },
  "properties": {
    "name": "Karnataka"
  }
}
I found India and Karnataka GeoJSON from link. It has other country and states too.
Below python function plots Choropleth Map when region and city information generated previously is passed to it.
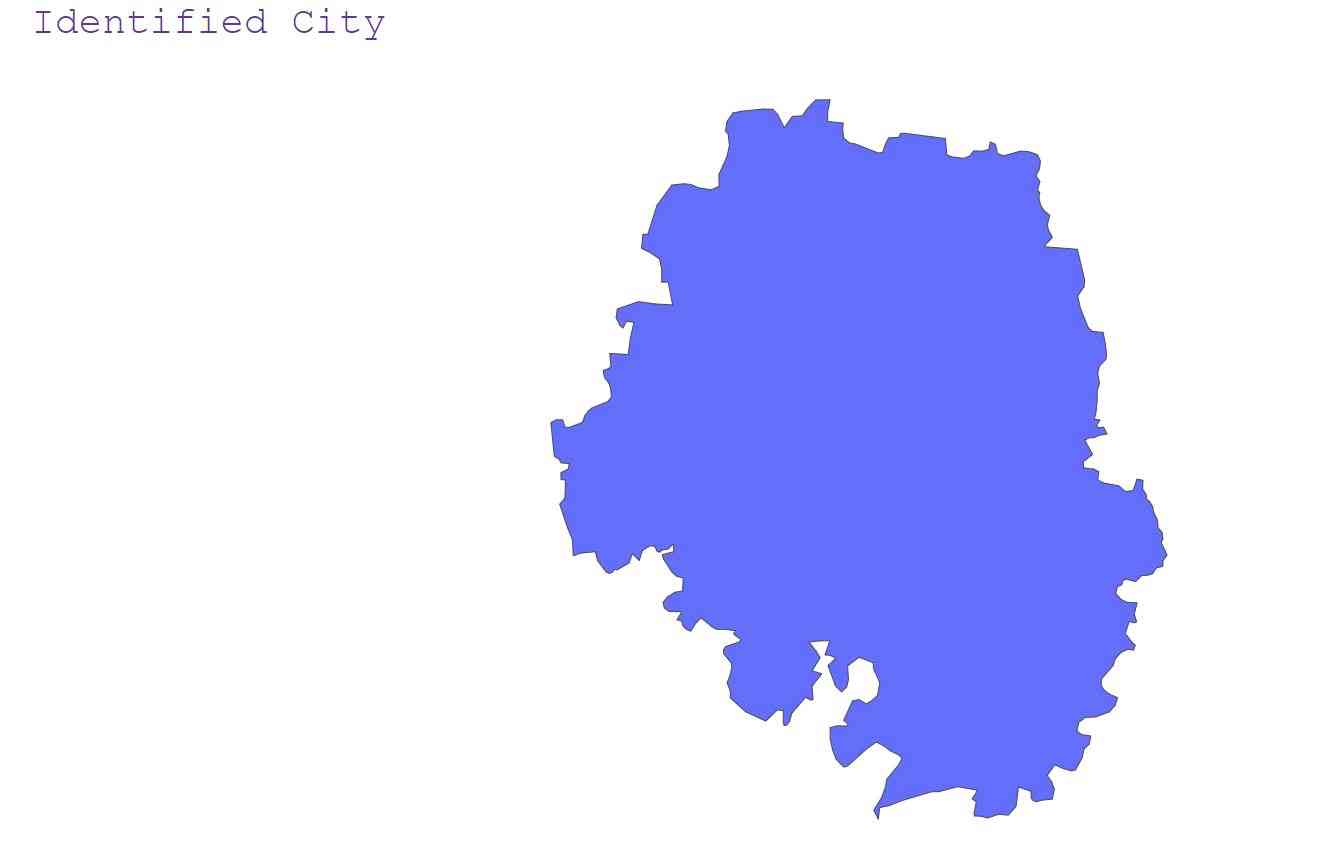
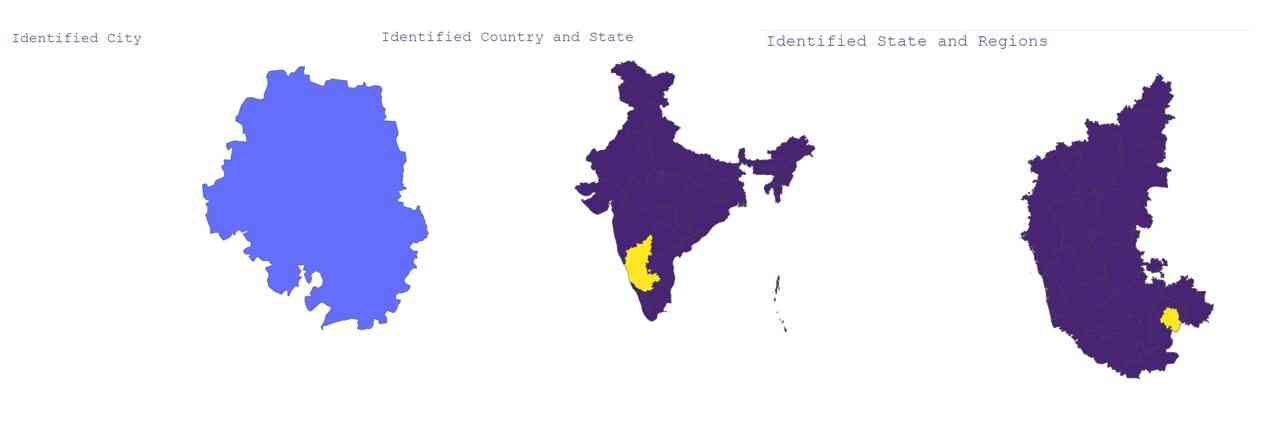
def plotCities(detectedRegions,detectedCities):
    #check if state detected is Karnataka
    if 'Karnataka' in detectedRegions:
        #Read Karnataka GeoJSON
        with open('karnataka_district.json') as response:
            counties = json.load(response)
        #Read All the state information of Karnataka
        df = pd.read_csv("Karnataka.csv", dtype={"district": str})
        plotData = {}
        cities = []
        count = []
        #Check if detected city is part of karnataka
        for city in detectedCities:
            if len(df['district'].str.contains(city))>0:
                cities.append(city)
                count.append('1')
            else:
                pass
        #Create plotting data
        plotData.update({"city":cities,'count':count})
        plotDf = pd.DataFrame(plotData, columns = ['city','count'])
        #Plot Map
        fig = px.choropleth(plotDf, geojson=counties,
                            color="count",
                            locations="city",
                            featureidkey="properties.district",
                            projection="mercator",
                            color_continuous_scale="reds",
                            range_color=(0, 10))

        fig.update_geos(fitbounds="locations", visible=False)
        fig.update_layout(title="Identified City",
                            font=dict(family="Courier New, monospace",
                            size=30,
                            color="RebeccaPurple"))
        return fig
Output:
Below python function plots Regions Choropleth Map when region and city information generated previously is passed to it.
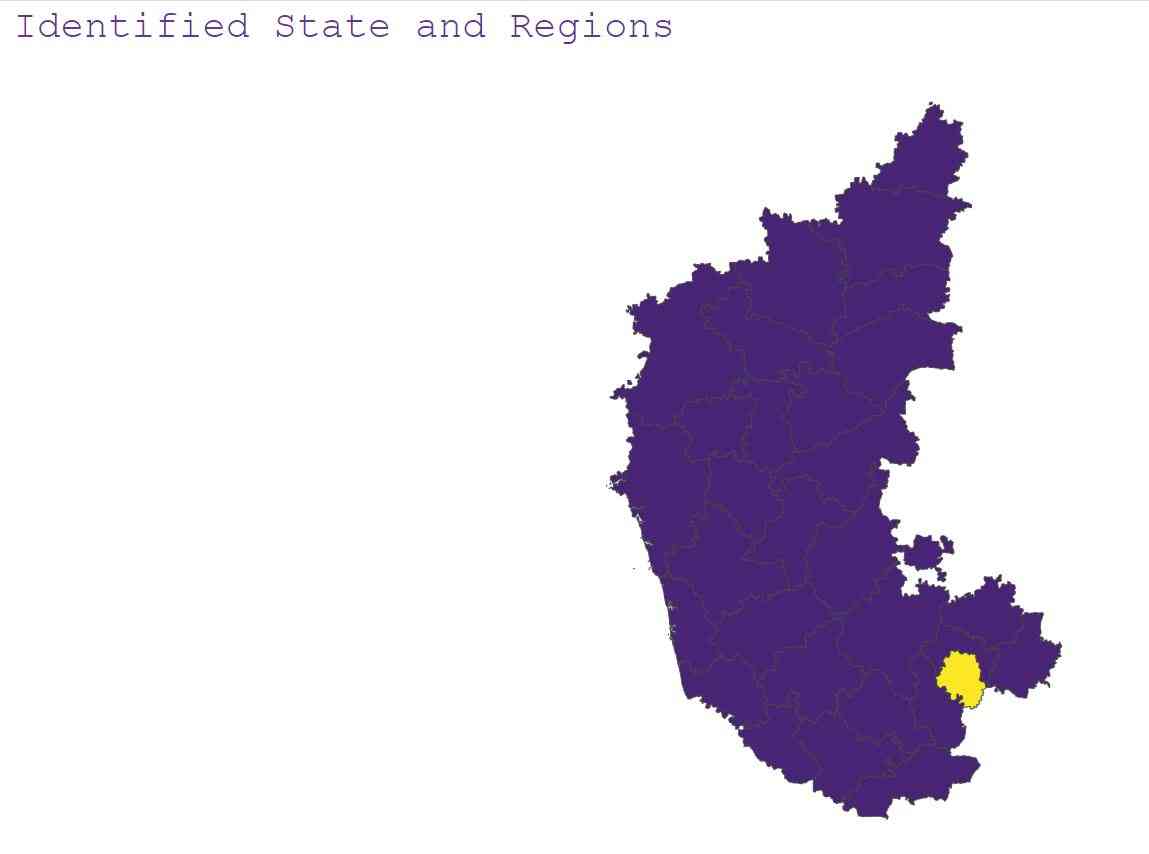
def plotRegions(detectedRegions,detectedCities):
    if 'Karnataka' in detectedRegions:
        with open('karnataka_district.json') as response:
            counties = json.load(response)
        df = pd.read_csv("Karnataka.csv", dtype={"district": str})
        df1=df.copy()
        for city in detectedCities:
            try:
                index = int(df.loc[df.district == city].index[0])
                df1.at[index,'count'] = 10
            except:
                pass
        fig = px.choropleth(df1, geojson=counties,
                            color="count",
                            locations="district",
                            featureidkey="properties.district",
                            projection="mercator",
                            color_continuous_scale="Viridis",
                            range_color=(0, 10))

        fig.update_geos(fitbounds="locations", visible=False)
        fig.update_layout(title="Identified State and Regions",
                            font=dict(family="Courier New, monospace",
                            size=30,
                            color="RebeccaPurple"))
        return fig
Output:
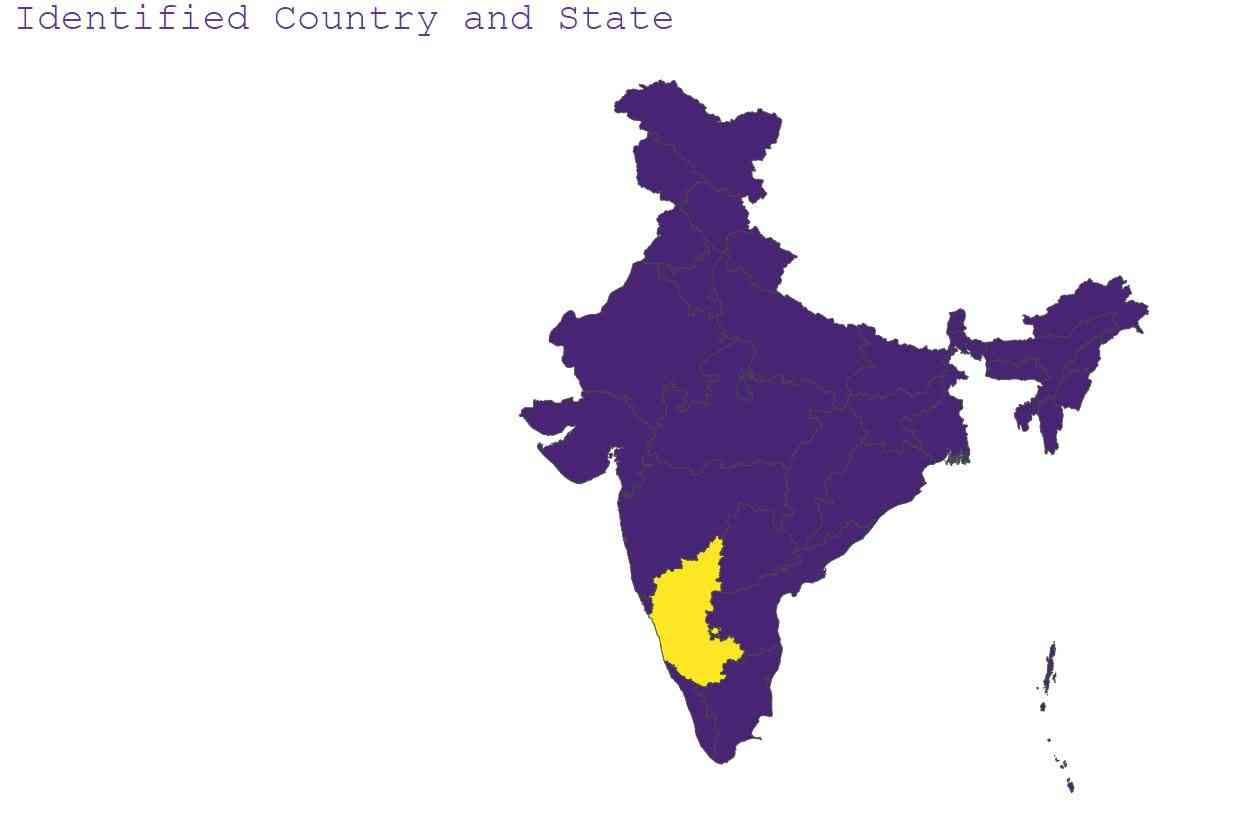
Below python function plots Country Choropleth Map when Country and region information generated previously is passed to it.
def plotCountry(detectedCountry,detectedRegions):
    if 'India' in detectedCountry:
        with open('indiaGeoJson.json') as response:
            geojson = json.load(response)
        df = pd.read_csv("India.csv", dtype={"state": str})
        df1=df.copy()
        for state in detectedRegions:
            try:
                index = int(df.loc[df.state == state].index[0])
                df1.at[index,'count'] = 10
            except:
                pass
        fig = px.choropleth(df1, geojson=geojson,
                            color="count",
                            locations="state",
                            featureidkey="properties.ST_NM",
                            projection="mercator",
                            color_continuous_scale="Viridis",
                            range_color=(0, 10))
        fig.update_geos(fitbounds="locations", visible=False)
        fig.update_layout(title="Identified Country and State",
                            font=dict(family="Courier New, monospace",
                            size=30,
                            color="RebeccaPurple"))
        return fig
Output:
Combining all these function to the main function as below
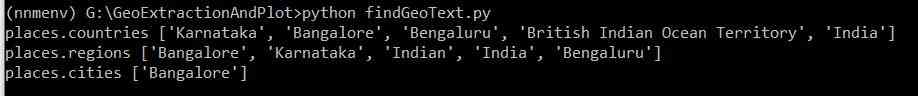
if __name__ == "__main__":
    detectedCountry,detectedRegions,detectedCities=getGeoGraphy(text)
    plotCities(detectedRegions,detectedCities).show()
    plotRegions(detectedRegions,detectedCities).show()
    plotCountry(detectedCountry,detectedRegions).show()
    print("places.countries", detectedCountry)
    print("places.regions",detectedRegions)
    print("places.cities",detectedCities)
Final output:
Clone and Run the project
- GitHub repository has all the files used in this project.
- Download/Clone code
- Follow create Python environment steps.
- replace your text in the code.
- python findGeoText.py
Demo
Watch below video to see more examples
Great, iNNovationMerge hope that you have understood how to Extract Information from Text and Plot on Map using NLP